Nine times out of ten, the hardest part of blogging is figuring out exactly what to talk about – but then finding inspiration through the fans. The other one time out of ten, the hardest part is arguing with disgruntled fans on Twitter.
Welcome to the best of both worlds.
BABIP – at least on White Sox Twitter – seems to be a hot topic a lot. It’s used, routinely, as a way among groups to either discuss and – often – dismiss analytics as a whole or as a statistical be-all and end-all. If you’re familiar with White Sox Twitter, you know the groups I’m talking about. Likely, those same groups aren’t reading articles from me, but I digress.
Like any statistic, BABIP is only helpful with a proper understanding of its purpose. From Tim Anderson to Yoan Moncada, to luck, and everything in between, we are going to discuss BABIP, its strengths, its weakness, and the best way to interpret it. My goal in writing this article is simple: after today, I never want to talk about BABIP again. I’m over it. I hope, by the end, everyone references this article in future BABIP discussions.
With that, let’s begin.
What is BABIP?
Batting Average on Balls in Play (BABIP) is exactly what it sounds like: what is your batting average on balls that are in play and don’t leave the ballpark? Here’s the formula, for any fellow nerds:

BABIP is a pretty simple concept, but that, like many things in life, leads to an oversimplification of the concept. As a rule of thumb, a .300 BABIP is pretty much league-average. However, comparing to league-average is not what is important. Rather, what is important is comparing a player’s BABIP in any given season to his historical BABIP. More on this to come.
For now, I think we all have a pretty good baseline understanding of what BABIP is. Let’s get into the finer details.
What Influences BABIP?
There are three main factors that influence BABIP: defense, luck, and talent. If you’re a Sox fan, you know all three of these have been discussed before on Twitter. All three areas come back to a simple concept: hitters do not have control over every aspect of the game when they are hitting.
What do I mean by this? You’ll see as we break down each area.
Defense
So often after we watch a defender make a great play, we quip that the player got “BABIP’d.” At the same time, when someone takes advantage of Miguel Sano playing 3B and sneaks one down the line, we dub the player “a BABIP god.” What does all of this mean?
Players have no control over the defenses they’re facing, and they can only direct their hits to a limited extent. Even someone as good as Tony Gwynn couldn’t control exactly where he hit the ball. Additionally, a batter that consistently hits into a shift may have a lower BABIP than a typical player – that is, so long as the shift is doing its job. Again, more on this to come.
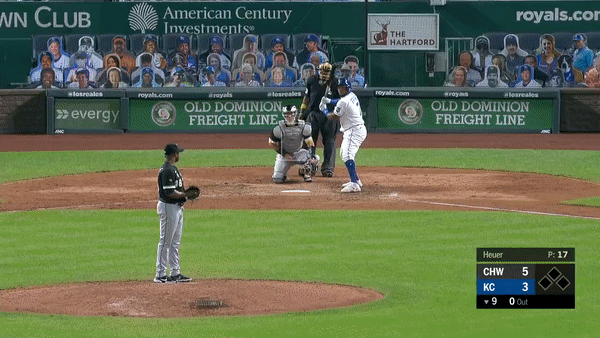
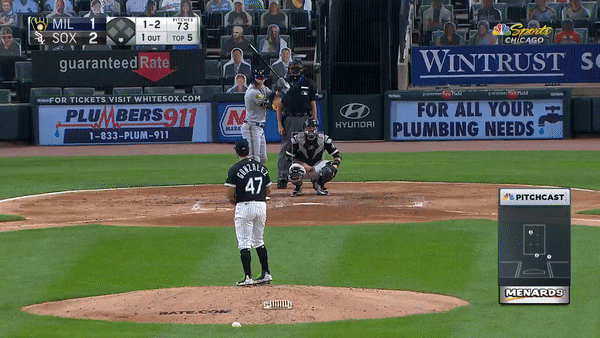
Here are two examples of the effect defense plays on BABIP – both good and bad. I’m sure you can guess which is which.
Talent Level
Talent level involves things that a player directly has an effect on: the ball’s exit velocity and launch angle. In other words, through a hitter’s swing and natural talent level, he can control how hard he hits the ball and how high into the air he hits it. This also, as we discussed in the last section, involves where he hits the ball, to an extent. But, from there, gravity/nature/fielding takes over, and the hitter no longer has control of the situation.
Obviously, the harder a ball is hit, the more likely it is to fall in for a hit. Additionally, line drives go for hits more often than ground balls. More hard hits balls and more line drives, in general, are signs of a better hitter. Thus, again in general, a better hitter will usually have a higher BABIP than a worse hitter. A good hitter might be able to register a hit on 35% of their balls in play with consistency, but because BABIP is also influenced by defense and luck, using BABIP to capture “talent” is difficult, though not impossible.
Things that should be considered “talent” that can contribute to BABIP luck: strength and speed. More on this to come.
Luck
Ah, luck. A familiar concept on White Sox Twitter. A bloop hits fall in. A batter turns a pitch into a dribbler that just sneaks past the third baseman. On the other hand, a barreled-up ball may go right to where a fielder is standing – a “Hang Whiff ’em,” in Hawk terminology.
Hits can fall in even against the best pitches and the best defenses due to simple luck. Batters and pitchers do not have complete control over where a ball lands, so even high-quality contact can turn into outs and low-quality contact can turn into hits. In the long run, this will even out, but according to most studies on this topic, it takes a pretty significant sample to do so – well over 1,500 PA.
Still not convinced of luck in baseball? See below:
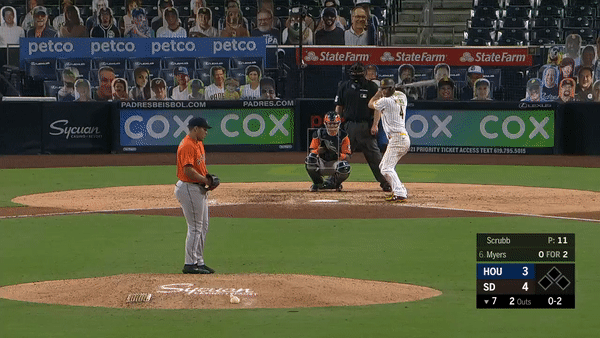
Skip to 1:08 in this video for another example of luck in baseball. Heck, if you need more examples of “luck” in baseball for proof it exists, just watch that entire video.
Evaluating a Player Using BABIP
As we discussed above, BABIP is helpful because understanding how often a player gets a hit on a ball in play can provide a lot of information on the hitter – more than you’d think from just one number.
For batters, BABIP can be used as an indication about the batter’s overall quality of contact if you have a large enough sample of balls in play. Over three seasons (1,500 PA), if a batter has a .345 BABIP, it is probably safe to say that batter is above average in this aspect of the game and is probably making better contact on average than most.
However, changes in BABIP are to be met with caution. If a batter has consistently produced a .310 BABIP and all of a sudden starts a season with a .370 BABIP, you can likely identify this as an instance in which the batter has been lucky, unless there has been a significant change in their style of play. In other words, BABIP allows us to see if a below-average hitter seems to be getting a boost from poor defenses or good luck or if a good hitter is getting docked for facing good defenses and having bad luck.
For hitters, we use BABIP as a gut check that tells us if a player’s overall batting line is sustainable. Virtually no hitter is capable of producing a BABIP of .380 or higher on a regular basis, and anything in the .230 range is also very atypical for a major league hitter, according to Fangraphs.
Don’t believe me on this one? Here are the 20 best season since 1945 in BABIP. The first column is that season’s BABIP, followed by the player’s career BABIP before that season, and his BABIP in the next season.
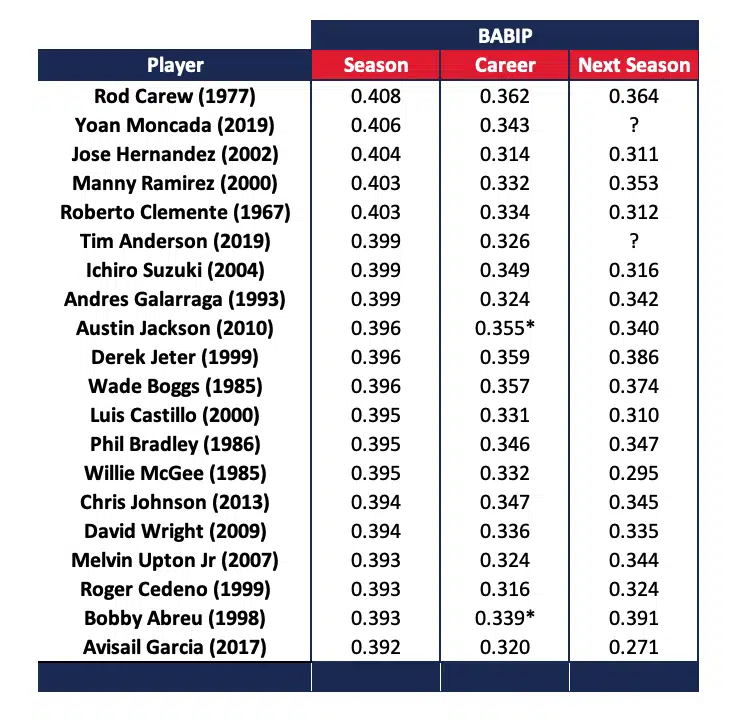
In almost every case, the hitter’s BABIP decreased by a considerable amount – most of the time to their career BABIP up to that point. However, in many cases, they decreased to levels that are still well above the league average. Why? Because many of these players are very, very good hitters. Caution should be used, though, because for every Rod Carew and Ichiro Suzuki on that list, there’s an Austin Jackson, Luis Castillo, or Chris Johnson. To express skepticism in a high BABIP season isn’t unwarranted, especially if that BABIP is well above a player’s career average BABIP.
Understanding this is important: BABIP relative to the player is far more important than BABIP relative to the league.
A hitter has control over how often they put the ball in play, how hard they hit the ball, and the general angle at which it comes off the bat. However, due to the unpredictability of luck and defense, a player’s BABIP isn’t always a complete reflection of a player’s performance. What does this mean? We universally agree that a .300 batting average is very good, no matter the player. However, we can’t draw conclusions from JUST a .300 BABIP. There are other stats and certain facets of a player’s game that should be used in tandem with BABIP to explain why a player achieved a certain BABIP.
For example, we mentioned two areas above: strength and speed. Indeed, if you look at the top 20 seasons in terms of BABIP, there are a lot of power hitters on that list. These power hitters 1) hit the ball hard, and 2) hit the ball at a launch angle such that they are able to optimize their talent (power). However, at the same time, they are able to help themselves to a little extra “luck” when a jam shot off their bat happens to fall just over the shortstop’s head. That’s skill-driven luck, but it is still luck. Power hitters in modern baseball who beat the shift also benefit from a higher BABIP. So, here, we see talent, luck, and defense all come into play as discussed above.
On the other hand, there are a lot of players in that top 20 list that are incredibly fast. These speedsters use their legs to beat out balls that, typically, hitters would not beat out. This is once again similar to the skill-driven luck concept we mentioned above when talking about a hitter’s strength. In other scenarios, a speedster with more bat control can often use the shift to his advantage, perhaps on a hit-and-run at the top of the lineup. Here we again see defense, talent, and luck all come into play when discussing how a player’s BABIP comes to be what it is.
However, at the end of the day, in each of those 20 season, no player came all that close to repeating their BABIP the next season. It speaks to the “luck” nature of BABIP. Even a Hall of Famer like Rod Carew couldn’t keep up a .400 BABIP forever.
All of this is still an over-simplification. When we talked about skill, we talked about how batted ball quality (line drives vs. ground balls) plays a huge role in driving BABIP over the course of a season. To get the fullest extent of how “likely” a player is to regress, you would have to do a dive into their batted ball data from season to season and take a more stat-based approach. This is a completely different study of course, but one that is driven by BABIP – and one we will get into shortly.
As I said, so much can be learned from one simple number, yet so often, we refuse to take the time out to learn all that can be learned. Twitter in a nutshell, I guess.
Why Do We Argue About BABIP?
One of the biggest problems when arguing about BABIP is that we argue over “luck” versus “skill/talent level.” If we can get to the root of that discussion, we would certainly argue less as a fan base about BABIP.
Let’s define luck. Here is the Oxford Dictionary definition of luck: Success or failure apparently brought by chance rather than through one’s own actions.
Let’s also define skill, per the Oxford Dictionary: The ability to do something well; expertise.
Skill is the element of baseball that a player controls – his swing path, the launch angle, and the exit velocity at which a ball leaves his bat. Luck is the element of baseball that occurs once the ball leaves a hitter’s bat. Once the ball leaves the bat, he is no longer in control of the outcome of the at-bat. This is why Statcast created all those “x” statistics I reference all the time. They’re meant to show you what, based on what the hitter can control (launch angle, exit velocity), the outcome typically should be or should be “expected” to be, rather than what it actually was. Here’s an example:
Person 1: “Damn, Eloy smoked that ball! 107 mph Exit Velocity, and Expected Batting Average (xBA) of .970!”
Person 2: “Yeah, too bad he hit it right at the Center Fielder. Eloy’s been getting screwed lately. Those will start falling soon though”
Even the hardest-hit baseballs have some element of luck to them, unless the xBA is 1.000 of course. Even if you get a hit on a ball with an xBA of .850, that means that you’re “lucky” that you weren’t part of the 15% of at-bats in which a ball hit exactly like yours didn’t fall for a hit.
So, yes, luck exists in baseball. If you don’t want to take it from me or from the paragraphs above, I encourage you to go to Fangraphs and read up on this topic.
“But Jordan, what about guys like Tony Gwynn? Guys who could control where they wanted to hit the ball.”
We talked about the importance of skill up above. However, even the most skilled players receive some element of luck, both good and bad. Acknowledging that a player almost always, in some form or another, is subject to luck isn’t a knock on the player at all; rather, it’s an acknowledgment of the human element of baseball. Saying luck doesn’t exist in baseball goes against every single argument any anti-analytics person has ever made to me.
“You nerds can’t play the game on a computer!”
You’re right, I can’t. If there was no such thing as luck though, I could.
See what I mean? The human element.
Case Studies: McCann, Anderson, and Moncada
Let’s be honest, White Sox fans started talking about BABIP because of three players last year: James McCann, Tim Anderson, and Yoan Moncada. With each of them, we are provided a mini-case study on using BABIP as an evaluation tool based on what we have talked about above.
James McCann
2019 James McCann is perhaps one of the best examples we have of the importance of referencing BABIP when discussing a player. If you recall, McCann was an All-Star in 2019 that seemed to fade off in the second half. Indeed, his .316/.371/.502 first half was followed by a .226/.281/.413 second half.
Let’s take one more step, however, and look at McCann’s BABIP. Again, to mirror the table above: the first column is McCann in the first half of 2019. The second column is McCann’s career BABIP before 2019. The third column is his BABIP in the second half of 2019.

The drop to his career average BABIP is why people expressed skepticism about what Tim Anderson and Yoan Moncada did in 2019 (again, we will get to this later).
What changed for McCann in the second half? Did he change his approach? Did the quality of contact change? Was he just that unlucky?
The best way to approach this is to look at a couple of things, and this goes for any hitter:
1) Average Launch Angle
2) Average Exit Velocity
3) Breakdown of Type of Ball In Play (GB%, FB%, LD%)
4) BA, xBA, and of course, BABIP
So, let’s look at this all for McCann, and break it down by each half:

What can we learn here?
1) McCann’s quality of contact didn’t change: he was still hitting the ball hard in the second half. In fact, on average, he hit the ball harder.
2) McCann hit a lot more fly balls in the second half. This is evidenced by both his increase FB% and his average Launch Angle increase of almost 5 degrees. He hit fewer ground balls and line drives as a result.
3) McCann’s first-half BABIP was insanely high, and according to the difference between his xBA and true BA, there was some “luck” involved with his BABIP. McCann hit .316 in the first half of 2019. He was “expected” to hit .277.
4) Everything came crashing down for McCann in the second half. His BABIP returned to his career average, as did his overall quality of contact.
The verdict? A lot of McCann’s 2019 split can be attributed to a difference in the type of player he was. He was simply hitting the ball differently between the two halves of 2019 – one half was line drive-oriented, the other was a regression to fly ball-oriented.
Was there some luck involved? Indeed. Let’s look at McCann’s BABIP, xBA, and BA on ground balls in each half of 2019:

What we see here is the insane amount of luck James McCann got on ground balls in the first half of 2019. It wasn’t so much that he was “unlucky” in the second half. Rather, it speaks to how “lucky” he was that he hit .273 on ground balls in the first half, rather than .219 like he would’ve been expected to based on the quality of contact.
So, you might ask, what has led to McCann’s success in limited time this year? It’s pretty simple. As we discussed before, line drives are hits more often than ground balls. By increasing his LD% from 23.5% to 27.8%, decreasing his GB% from 44.4% to 40.7%, and keeping his FB% relatively the same, McCann has improved his quality of contact beyond even his first half of 2019 levels. His BABIP so far? .367. As we talked about before, that’s still well above league-average, but if McCann is indeed a good hitter – which, I think we all think he is – that becomes a little bit more sustainable than .408.
I think the story of McCann is simple. After a regression to his old self in the second half of 2019, he made changes as a hitter that directly impacted the type of player he was and the skill level at which he played. In short, McCann has become a better player than he was, one that mirrors the approach taken in the first half of 2019. This will be important as we discuss our next case study.
Tim Anderson
Ah, yes, our most controversial case of a player’s BABIP. Tim Anderson’s .399 BABIP is arguably more talked about than Yoan Moncada’s .406 BABIP. The batting champion in 2019 reached new levels in his career last year.
That BABIP, being one of the top 20 in a season since 1945, obviously raised red flags for people who, much like with Moncada, wanted to dismiss the success due to luck. Let’s perform a similar exercise to that with McCann, except look at hit type for Anderson. How much luck was involved?

I have a hard time contributing too much of the difference between his BA and xBA on line drives to luck – line drives are mostly skill-driven hits, but they do explain part of the astronomical BABIP Anderson achieved in 2019. Fly balls are a similar story. However, what interests me is Anderson’s average on ground balls. League average BA on ground balls in 2019 was .242. Anderson not only beat the league average by around 60 points, but he beat his own xBA by 40 points. Some of this is no doubt driven by luck, but I think there is a skill aspect to this BABIP as well.
There is one thing about Tim Anderson that differentiates his name from the two others in this section: sprint speed. Tim Anderson is in the 92nd percentile for Sprint Speed – there are very few players in baseball faster than him. As a result, we see a lot of plays such as this one:
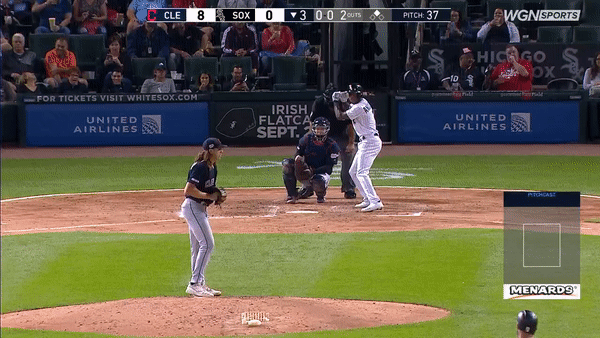
There’s luck involved there. Tim Anderson was fooled on a pretty good pitch from Clevinger and threw his bat at it. However, there is skill involved as well – Tim Anderson is a fast player who can beat out plays like that. Like we’ve talked about before: skill-driven luck that helps explain his high BABIP. This still remains a shortcoming of BABIP, but speed, much like strength, helps provide context to BABIP.
Tim Anderson won’t always be lucky enough that pitches he puts in play that he’s fooled on go for hits. However, a convincing argument can certainly be made that he can sustain a high BABIP throughout his career. A .399 BABIP is certainly pushing it, but this isn’t the case of a bad player getting extremely lucky. Rather, it’s a case of a good player making changes to his approach to become a better player.

Anderson substituted line drives and ground balls for fly balls in 2019. Much like a power hitter hits more fly balls, we see a contact-driven hitter making adjustments to his game that maximize his abilities.
There is also the stipulation we listed before: wild changes in BABIP need to be monitored over the course of 1,500 PAs or so – about 3 seasons worth of play. The 60% ground ball rate for Tim Anderson in 40 games this season is something to monitor. However, the great news is that we watch Tim Anderson every day, and we see the step forward he’s made as a ballplayer. We’ve seen it in the quality of contact, the approach at the plate, and the way he forces the issue on the base paths. We will likely see it in the results over the course of his career.
Yoan Moncada
Some of the most in-depth work I’ve ever written, in my opinion, was on Yoan Moncada and BABIP a few months ago. In order to get the fullest picture behind the case study of Moncada’s 2019 season, I encourage you to click here.
Let’s summarize that article a bit though, before pulling this all together:
1) Yoan Moncada was simply a different hitter in 2019 than his career before that point. He swung more often (47.3% from 41.1%) without swinging and missing more often (31.1% both years). He also barreled up a greater percentage of his pitches (12.2% from 9.6%), meaning he was hitting balls on the “sweet spot” much more often.
2) There was some luck associated with Yoan Moncada’s performance in 2019 that is clear by the fact that his actual batting average is higher than his expected batting average, especially for ground balls.
3) Moncada’s batting average on ground balls is a critic’s strongest point of analysis for a Yoan Moncada to regress in 2020. Yet, at the same time, his .323 xBA and .289 xwOBA says that he still made some very high-quality contact on ground balls.
4) Shifting likely played a large effect on Yoan Moncada’s 2019 BABIP. This borders the line of defense and luck, both of which we discussed above. I’m inclined to believe it’s a little bit of both, as we see in the video below:
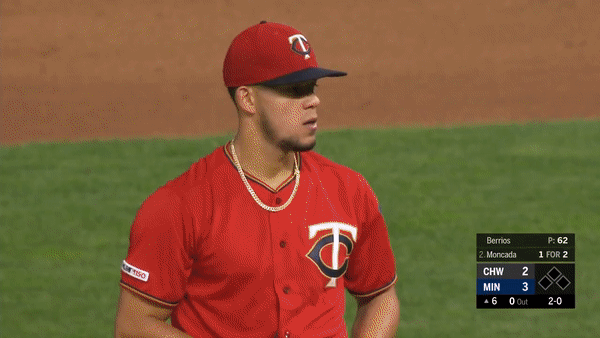
There are a lot more details to that on Yoan Moncada, but those are the main points. Basically, the takeaway is that there is luck involved in his BABIP, but it is not to be overblown due to average exit velocity, speed, and defense. I encourage you to read my other article for a deeper dive into it.
Let’s Bring Everything Together
Well, we certainly talked about a lot, didn’t we? Thanks for sticking around to this point, I hope you learned something to take to your friends. Just in case you got lost in my ramblings, let’s review:
1) BABIP (Batting Average on Balls in Play) measures exactly what it sounds like it does. There is no secret behind the formula either; it’s rather straightforward, despite the confusion that arises around the topic.
2) BABIP is influenced by three main factors: defense, skill, and luck. Strength, speed, and all other natural qualities of a hitter are all encompassed in that “skill” category. However, skill and luck are not the same things – though skill can be a driving factor in luck.
3) Quality of contact is incredibly important when talking about BABIP. Line drives go for hits more often than ground balls, and ground balls go for hits more often than fly balls. However, hitters should obviously be looking to maximize the hit type that maximizes their skills.
4) As we noticed with James McCann, a high or low BABIP is not necessarily a sign of luck. Sometimes, it’s a change in skill level. However, as we also learned with McCann, a BABIP that is substantially different from one’s career mark usually involves a level of luck. BABIP requires a large sample before it “stabilizes,” meaning that you can’t say a player has established a new talent level without a significant sample size.
5) .300 is a league-average BABIP. According to Fangraphs, the long-run ceiling on a player’s BABIP is about .380, as no player with more than 4,000 career PAs has ever had a career BABIP higher than that. In general, though, .350 is a much more realistic mark for the very best hitters in the league. As we’ve seen with Yoan Moncada and Tim Anderson, who are two very good hitters, high BABIPs are sustainable. However, not every high BABIP is sustainable at the same level. Tim Anderson won’t likely be able to keep around a .400 BABIP every season, even if he sustains a higher than average BABAIP. There’s a balance here.
6) When you analyze a player and start with their BABIP, dive deeper. Use hit type, GB%, FB%, LD%, Average EV, Average LA, xBA, BA, etc. There’s a world of statistics that can be used to dive deeper into what leads to a player’s BABIP. Which leads to the final takeaway…
7) The conversation should NEVER start and end with BABIP. If a player’s BABIP is the only thing discussed during a conversation about his success/failure, that is a bad conversation. There is not a single statistic in the world that can explain a hitter’s success/failure. There is always more to the story, which I’ve tried to show above.
With this, I hope we never talk about this topic again. I hope we understand the use of BABIP, what it means, and also, what it doesn’t mean. My hope is that anyone who likes statistics and analytics doesn’t try to use just this one number to try to explain a player’s success/failure; as we learned, so much goes into and can be learned from this one number. At the same time, I hope those who don’t like analytics stop using BABIP’s shortcomings to speak to a shortcoming of statistics or analytics in general. Analytics, of course, have their shortcomings. But, because you’re a human, so do your eyes, no matter how many baseball games you’ve watched. Both analytics and your eyes are there to help what the other misses.
I’ve said it before and I’ll say it again – baseball is best studied when using your eyes and the numbers. Everyone should be able to come together and analyze the game in a constructive and positive way, because everything that people can bring to the table is useful.
I hope someday, we reach that point. Until we do, I’ll be here, continuing to write these articles.
Thoughts? Comments? Let me know on Twitter! @jlazowski14
Make sure to check out Fangraphs and their excellent work on this topic as well.
Featured Photo: Chicago White Sox (@whitesox) / Twitter
